1
2
3
4
5
6
7
8
9
10
11
12
13
14
15
16
17
18
19
20
21
22
23
24
25
26
27
28
29
30
31
32
33
34
35
36
37
38
39
40
41
42
43
44
45
46
47
48
49
50
51
52
53
54
55
56
57
58
59
60
61
62
63
64
65
66
67
68
69
70
71
72
73
74
75
76
77
78
79
80
81
82
83
84
85
86
87
88
89
90
91
92
93
94
95
96
97
98
99
100
101
102
103
104
105
106
107
108
109
110
111
112
113
114
115
116
117
118
119
120
121
122
123
124
125
126
127
128
| import numpy as np
import cv2
import matplotlib.pyplot as plt
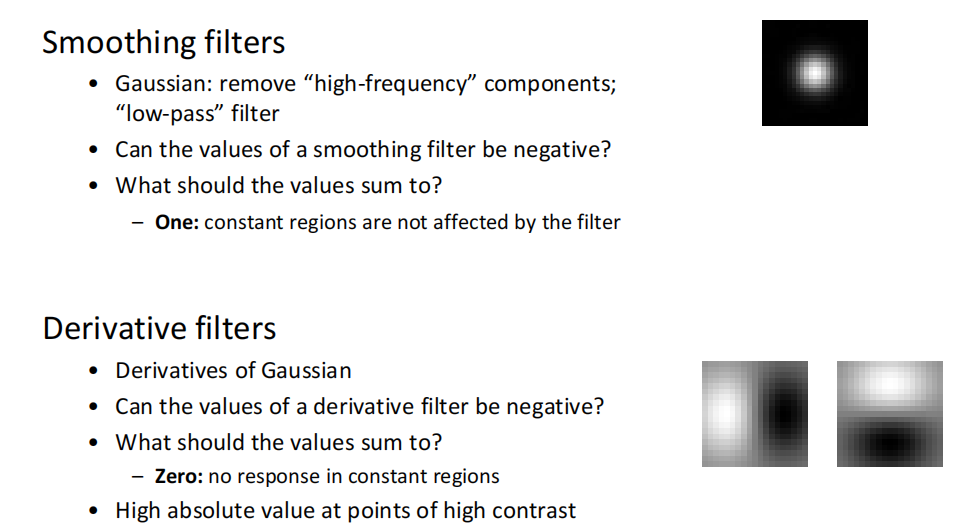
def get_gaussian(size=5, sigma=1):
assert sigma > 0 and size >= 3, "参数错误"
x, y = np.meshgrid(
np.linspace(-3 * sigma, 3 * sigma, size),
np.linspace(-3 * sigma, 3 * sigma, size)
)
gaussian = 1 / (2 * np.pi * sigma ** 2) * np.exp(-(x ** 2 + y ** 2) / (2 * sigma ** 2))
return gaussian / gaussian.sum()
def simple_2d_conv(x: np.ndarray, kernel: np.ndarray, mode: str = 'same'):
"""
对灰度图像进行2d卷积操作
:param x: 输入图像
:param kernel: 卷积核
:param mode: 卷积模式 full same valid
:return:
"""
assert len(x.shape) == 2 and len(kernel.shape) == 2, "只支持灰度图像"
assert kernel.shape[0] % 2 == 1 and kernel.shape[1] % 2 == 1, "参数错误"
assert mode in ['same', 'full', 'valid'], "卷积模式错误"
h, w = x.shape
kh, kw = kernel.shape
if mode == 'full':
x = np.pad(x, ((kh - 1, kh - 1), (kw - 1, kw - 1)), 'constant', constant_values=0)
h += kh - 1
w += kw - 1
elif mode == 'same':
x = np.pad(x, ((kh // 2, kh // 2), (kw // 2, kw // 2)), 'constant', constant_values=0)
else:
h -= kh - 1
w -= kw - 1
res = np.zeros([h, w])
for i in range(h):
for j in range(w):
res[i, j] = np.sum(x[i:i + kh, j:j + kw] * kernel)
return res
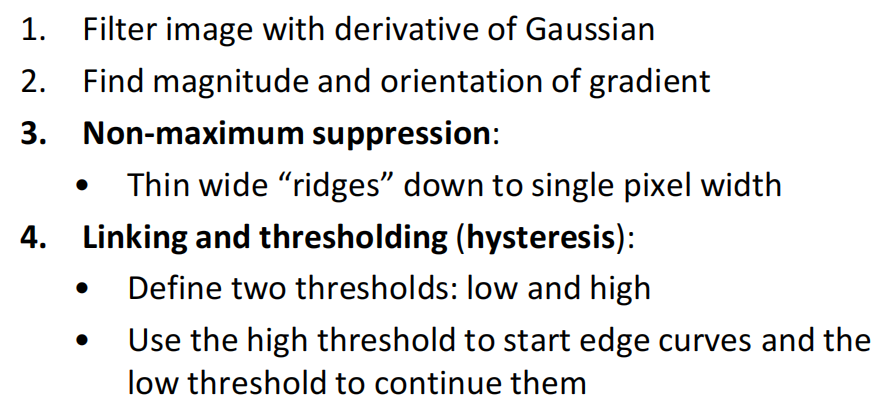
def non_max_suppression(x, theta):
res = np.zeros_like(x)
for i in range(1, x.shape[0] - 1):
for j in range(1, x.shape[1] - 1):
abs_theta = abs(theta[i, j])
if abs_theta <= np.pi / 4:
interpolation1 = np.tan(abs_theta) * x[i + 1, j] + (1 - np.tan(abs_theta)) * x[i + 1, j + 1]
interpolation2 = np.tan(abs_theta) * x[i - 1, j] + (1 - np.tan(abs_theta)) * x[i - 1, j - 1]
elif abs_theta <= np.pi / 2:
interpolation1 = 1 / np.tan(abs_theta) * x[i, j + 1] + (1 - 1 / np.tan(abs_theta)) * x[i + 1, j + 1]
interpolation2 = 1 / np.tan(abs_theta) * x[i, j - 1] + (1 - 1 / np.tan(abs_theta)) * x[i - 1, j - 1]
elif abs_theta <= np.pi * 3 / 4:
interpolation1 = np.tan(abs_theta) * x[i, j + 1] + (1 - np.tan(abs_theta)) * x[i - 1, j + 1]
interpolation2 = np.tan(abs_theta) * x[i, j - 1] + (1 - np.tan(abs_theta)) * x[i + 1, j - 1]
else:
interpolation1 = -np.tan(abs_theta) * x[i - 1, j] + (1 + np.tan(abs_theta)) * x[i - 1, j + 1]
interpolation2 = -np.tan(abs_theta) * x[i + 1, j] + (1 + np.tan(abs_theta)) * x[i + 1, j - 1]
if x[i, j] >= max(interpolation1, interpolation2):
res[i, j] = x[i, j]
return res
def double_thresholding(x, low_threshold, high_threshold):
thres_map = np.zeros_like(x)
for i in range(x.shape[0]):
for j in range(x.shape[1]):
if x[i, j] >= high_threshold:
thres_map[i, j] = 2
elif x[i, j] >= low_threshold:
thres_map[i, j] = 1
cc = 1
for i in range(cc, x.shape[0] - cc):
for j in range(cc, x.shape[1] - cc):
if thres_map[i, j] == 1:
if np.any(thres_map[i - cc:i + cc, j - cc:j + cc] == 2):
thres_map[i, j] = 2
else:
thres_map[i, j] = 0
thres_map[thres_map == 1] = 0
return thres_map
img = cv2.imread("tiger.jpg", cv2.IMREAD_GRAYSCALE)
kernel = np.array([[2, 4, 5, 4, 2], [4, 9, 12, 9, 4], [5, 12, 15, 12, 5], [4, 9, 12, 9, 4], [2, 4, 5, 4, 2]]) / 159
conv_img = simple_2d_conv(img, kernel, 'valid')
Sobel_X = np.array([[-1, -2, -1], [0, 0, 0], [1, 2, 1]])
Sobel_Y = np.array([[-1, 0, 1], [-2, 0, 2], [-1, 0, 1]])
sobel_x_img = simple_2d_conv(conv_img, Sobel_X, 'valid')
sobel_y_img = simple_2d_conv(conv_img, Sobel_Y, 'valid')
intensity = np.abs(sobel_x_img) + np.abs(sobel_y_img)
intensity = intensity / np.max(intensity) * 255
theta_map = np.arctan2(sobel_y_img, sobel_x_img)
non_max_img = non_max_suppression(intensity, theta_map)
double_threshold_img = double_thresholding(non_max_img, 5, 40)
plt.subplot(2, 2, 1)
plt.imshow(img, cmap=plt.get_cmap('gray'))
plt.title('Original')
plt.subplot(2, 2, 2)
plt.imshow(conv_img, cmap=plt.get_cmap('gray'))
plt.title('Gaussian Filter')
plt.subplot(2, 2, 3)
plt.imshow(cv2.Canny(img, 90, 200), cmap=plt.get_cmap('gray'))
plt.title('OpenCV Canny')
plt.subplot(2, 2, 4)
plt.imshow(double_threshold_img, cmap=plt.get_cmap('gray'))
plt.title('Canny')
plt.show()
|
